Women In STEM Statistics: Progress and Challenges

Women have been underrepresented in STEM (science, technology, engineering and mathematics) for many years, both in university and in industry.
Using data from HESA and findings from the UK Government census data on occupations, we take a closer look at some women in STEM statistics.
There are some notable imbalances across STEM subjects at undergraduate level, with high numbers of female and non-binary students enrolling in subjects such as Psychology and Subjects Allied to Medicine (e.g. nursing), which are often amongst the lower-paid career routes. In core STEM subjects, however, women and non-binary people are dramatically underrepresented (with the exception of Physical Sciences which is approaching 50/50 representation). This article also considered the representation of women and non-binary people in the UK workforce within STEM related professions, and specifically within leadership roles.
At STEM Women we address the gender imbalance in STEM fields by hosting networking and recruitment events which bring diverse STEM talent into contact with employers who recognise the need for a representative and inclusive STEM workforce.
Women in STEM Statistics
How many women and non-binary people enrol on STEM courses?
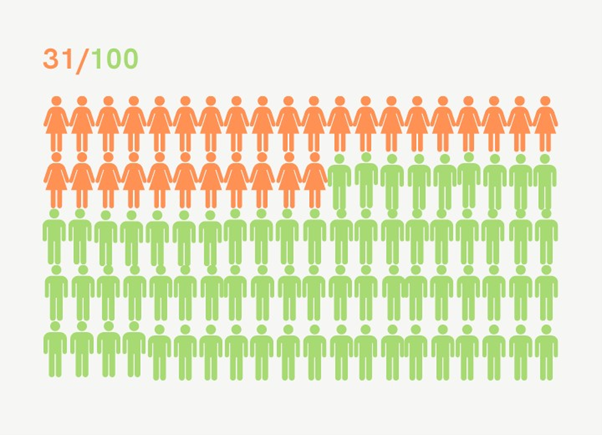
According to recent HESA data, 31% of core STEM students in Higher Education in the UK are women or non-binary.
Core STEM subjects – Female and non-binary students
2022/23
Number of female students – 123,180 – 31%
Subject breakdown
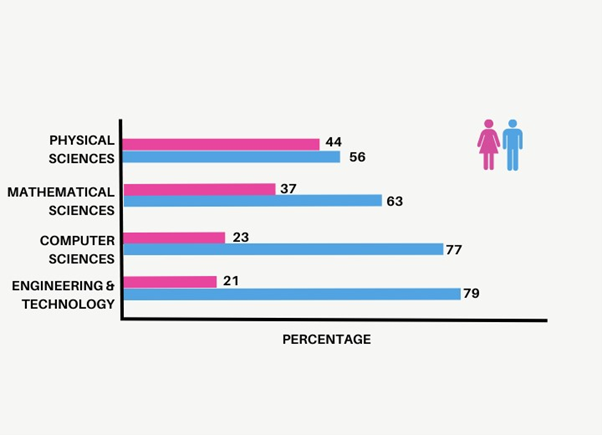
Physical sciences
Female and non-binary – 29,540 – 44%
Male – 37,670 – 56%
Total – 67,205
For the 22/23 academic year, 44% of students enrolling into physical sciences were female or non-binary.
There is an overall increase in the number of students who enrolled onto Physical Science courses over the last 5 years (in 2017/18 the total number of Physical Science students was 57,240). The percentage of female and non-binary students has increased from 39% to 44% (nb. Non-binary students account for 0.3% of this total).
Mathematic sciences
Female and non-binary – 17,585 – 37%
Male – 29,570 – 63%
Total – 47,145
For the 22/23 academic year, 37% of students enrolling into mathematical sciences were female or non-binary.
Again, there has been an overall increase in the number of students enrolled (up from 38,465 in 2017/18), and therefore an increase in the number of women and non-binary Mathematical Sciences students. However, the ratio of male to female and non-binary students has remained the same, at 63% and 37% respectively. (n.b non-binary students account for 0.3% of the combined total).
Computer sciences
Female and non-binary – 37,790 – 23%
Male – 126,465 – 77%
Total – 164,260
For the 22/23 academic year, 23% of students enrolling into computer sciences were female or non-binary.
There has been a great increase in the overall number of students enrolled in Computer Sciences – up from only 24,090 in 2017/2018. This means that there is a much higher number of female and non-binary Computer Science students overall. However, the representation of women and non-binary people has increased only slightly, from 19% to 23% over this 5 year period. At this rate, it would take more than 30 years to reach parity in this subject area.
Engineering and technology
Female and non-binary – 38,265 – 21%
Male – 147,455 – 79%
Total – 185,725
There has been an increase in the overall number of students enrolling onto Engineering and Technology courses (up from 126,660 in 2017/18) and so, again, there is an increase in the number of female and non-binary students overall. The percentage increase has seen little change, however, moving from 21% in 2017/18 to 23% in 2022/23. At this rate of change, it would take more than 70 years to reach parity in this subject area.
Women in STEM Statistics – General Outlook for Female and Non-Binary Graduates
Of course, we cannot simply look at the number of women and non-binary people enrolling in STEM, particularly given the retention issues in these areas. We also need to consider how many of these students actually progress and graduate from their chosen programme.
Since 2015, the number of women and non-binary people women graduating in core STEM subjects has grown from 22,020 to 35330 in the latest HESA data covering academic years 2019/20 to 2021/22. On the surface this would appear to show a linear increase, however, due to the more rapid growth in the number of men graduating in these subject areas, the percentage of women in STEM has fluctuated from 25%, down to 24%, and finally up to 27% in 2021/22.
It is important to consider any changes during this period in light of the Covid-19 pandemic, and to be aware of the impact in Higher Education.
Core STEM subjects – Female and Non Binary Graduates
2015 – 22,020 – 25%
2016 – 22,340 – 24%
2017 – 22,950 – 25%
2018 – 24,000 – 26%
2019 – 24,705 – 26%
Latest update: 2019/20 to 2021/22 – 35,330 – 27%
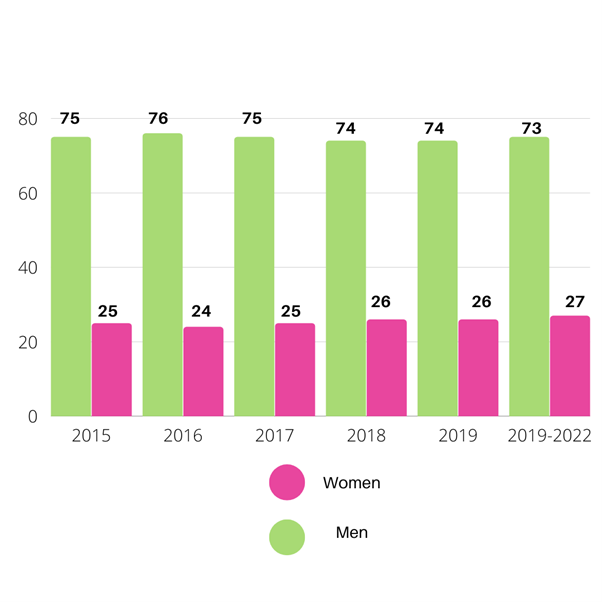
This data shows that for a number of years there was only a small increase in the number of female students graduating in core STEM subjects year-on-year. In recent years, however, we have seen a much greater increase in the number of STEM students overall. One potential factor in this is the covid-19 pandemic, which created both an increased interest in science and healthcare, and also an increase in the overall number of students due to disrupted education and fears about the labour market. This means that, although the overall number of female graduates in STEM-related disciplines has increased, there has been little impact on the relative representation of women in STEM at this stage, with male graduates still making up the vast majority.
Subject breakdown – Female Graduates
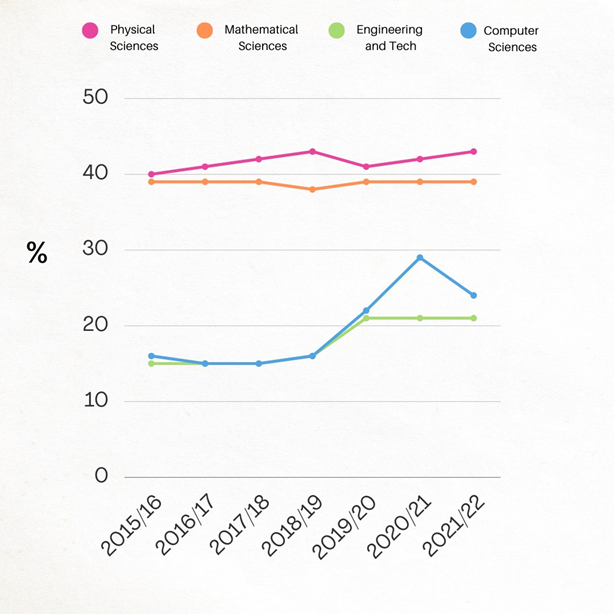
Physical sciences
2015/16 – 7,505 – 40%
2016/17 – 8,015 – 41%
2017/18 – 8,435 – 42%
2018/19 – 8,325 – 43%
2019/20 – 7,335 – 41%
2020/21 – 7,600 – 42%
2021/22 – 8,290 – 43%
From 2015 to 2021, the number of women graduating in physical science-related degrees has increased by 3%. We can see that there was a decrease in the overall number of students studying Physical Sciences between 2019 and 2021, but that this seems to have recovered by 2021/22. Overall, the representation of women in Physical Sciences is one of the highest within the core STEM subjects, but equal representation is still many years away given the current rate of change.
Mathematical science
2015/16 – 3,620 – 39%
2016/17 – 3,765 – 39%
2017/18 – 3,690 – 39%
2018/19 – 3,660 – 38%
2019/20 – 5,635 – 39%
2020/21 – 6,365 – 39%
2021/22 – 6,225 – 39%
In mathematical sciences the number of women graduating grew from 3,620 in 2015/2016 to 6,225 in 2021/22, however, the percentage overall has remained static at 39% throughout this period, with the only variation being a slight decrease to 38% in 2018/19. Whilst it is encouraging to see the increasing number of women and non-binary people graduating in Mathematical Sciences, it seems that overall representation is difficult to change.
Engineering and technology
2015/16 – 4,480 – 15%
2016/17 – 4,700 – 15%
2017/18 – 5,050 – 15%
2018/19 – 5,375 – 16%
2019/20 – 11,295 – 21%
2020/21 – 12,335 – 21%
2021/22 – 13,100 – 21%
The percentage and overall number of female Engineering and Technology graduates saw a marked increase in 2019/20, but remains low at 21%. In recent years, the level of representation has been static, with men making up 79% of Engineering and Technology graduates.
Computer science
2015/16 – 2,925 – 16%
2016/17 – 3,020 – 15%
2017/18 – 3,220 – 15%
2018/19 – 3,490 – 16%
2019/20 – 7,240 – 22%
2020/21 – 9,030 – 29%
2021/22 – 12,190 – 24%
Computer science-related degrees have had a low percentage of female graduates over many years. The overall number of Computer Science graduates has seen huge increases – from just over 18000 in 2015/16 to more than 50000 in 2021/22, reflecting the rapid developments within computing, technology and AI, and the resulting impact on the labour market in this area. Representation of women amongst Computer Science graduates has increased, reaching a high of 29% in 2020/2, but the most recent data shows a decrease back to 24% and the overall level of representation remains low, despite the widely-recognised importance of diversity in this area.
The Female STEM Workforce
The lack of representation of Women in STEM within Higher Education of course impacts the workforce within STEM industries. At STEM Women, we are working to increase diversity in STEM, recognising that the current rate of change is insufficient to ensure an inclusive future workforce.
Statistics from the most recent labour market data shows that the STEM sector is continuing to grow at a rapid rate, with more than 1 million more STEM jobs created over the last 7 years. However, the representation of women in STEM remains low, at just over one quarter of the overall STEM workforce. Latest government census figures show that women now make up 26% of the STEM workforce. Whilst this is a gradual increase, at the current rate of change we would not see equal representation in STEM until the year 2070.
Women in STEM workforce
2016 – 802,848 – 21%
2017 – 864,278 – 23%
2018 – 908,318 – 22%
2019 – 1,019,400 – 24%
Latest update: 2022/23: 1,137,200 – 26%
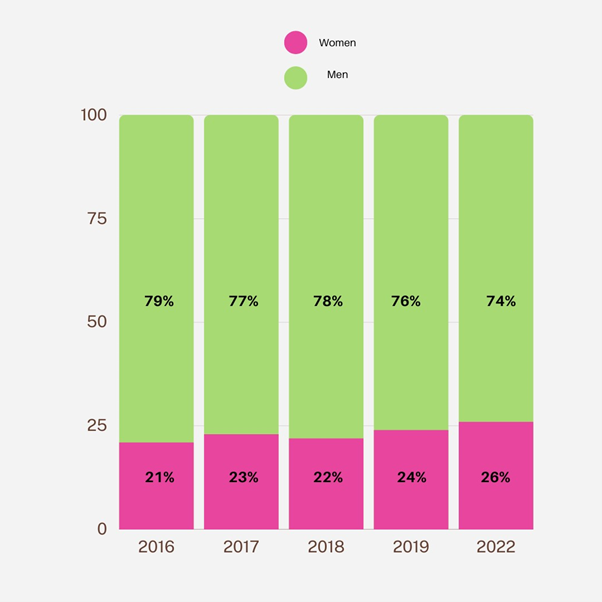
Women now make up 26% of the STEM workforce.
Subject breakdown – STEM workforce
Engineering professionals
2016 – 36,734 – 8%
2017 – 48,449 – 11%
2018 – 49,250 – 10%
2019 – 50,475 – 10%
2022/23 – 62,700 – 12%
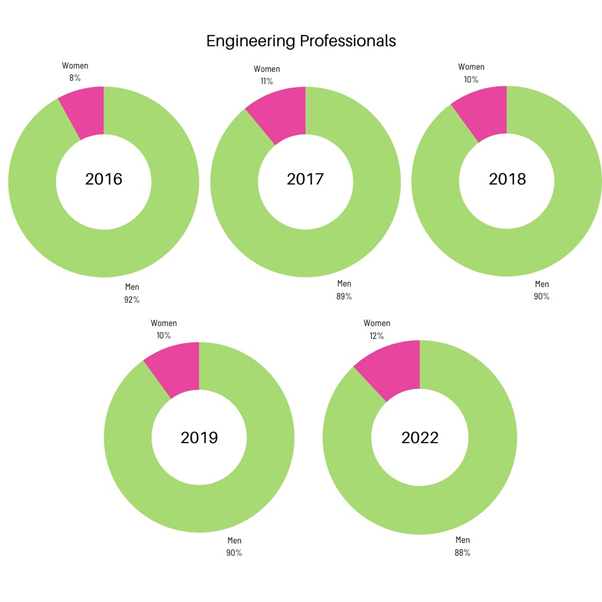
Over the last seven years, the number of women working in engineering roles has risen from 36,734 to more than 62,000. This is positive data; however, the overall percentage split is still very low and has progress in this area is slow, at an average of 1% every two years.
Science professionals
2016 – 64,563 – 41%
2017 – 57,372 – 42%
2018 – 58,725 – 42%
2019 – 62,675 – 46%
2022/23 – 102,500 – 44%
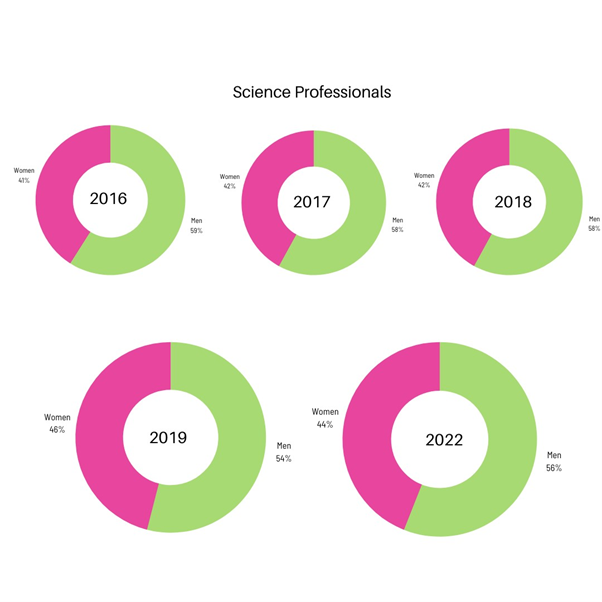
Women in STEM statistics for science professionals continue to show positive results for a growing gender diversity in these roles, although there has been a slight decrease in this area in recent years. Women now make up 44% of the total science professional workforce.
Science and Engineering technicians
2016 – 75,129 – 27%
2017 – 97,064 – 27%
2018 –87,150 – 26%
2019 – 83,525 – 25%
2022/23 – 70,100 – 30%
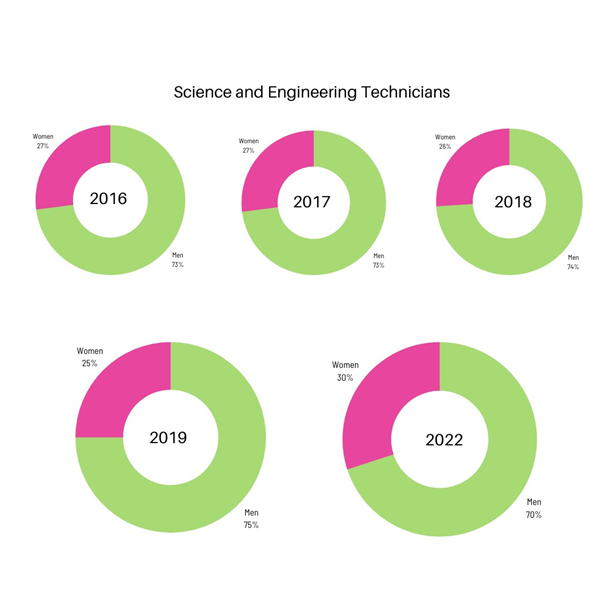
There has been an overall decrease in the number of people employed in Science and Engineering Technician roles, which explains why the overall percentage of women employed in this area has increased, whilst the actual number has increased.
Women currently make up just under one third of those employed in this field.
IT Professionals
2016 – 183,149 – 18%
2017 – 172,411 – 17%
2018 – 181,575 – 17%
2019 – 180,600 – 16%
2022/23 – 261,400 – 19%
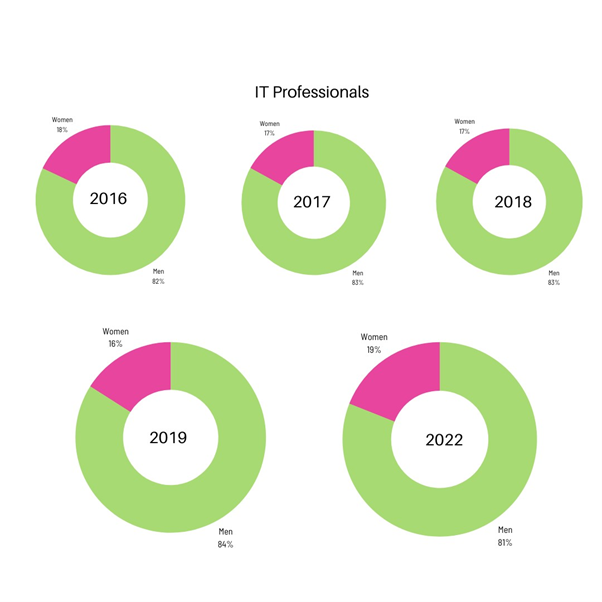
There has been a dramatic increase in the overall number of people working in IT roles, no doubt reflecting the rapid developments in technology, computing and AI. This is reflected in an increase of more that 80,000 women working in IT between 2019 and 2023, but the representation of women in it remains low, at 19%.
IT Technicians
2016 – 43,087 – 19%
2017 – 46,523 – 19%
2018 – 53,600 – 21%
2019 – 53,400 – 21%
2022/23 – 67,300 – 23%
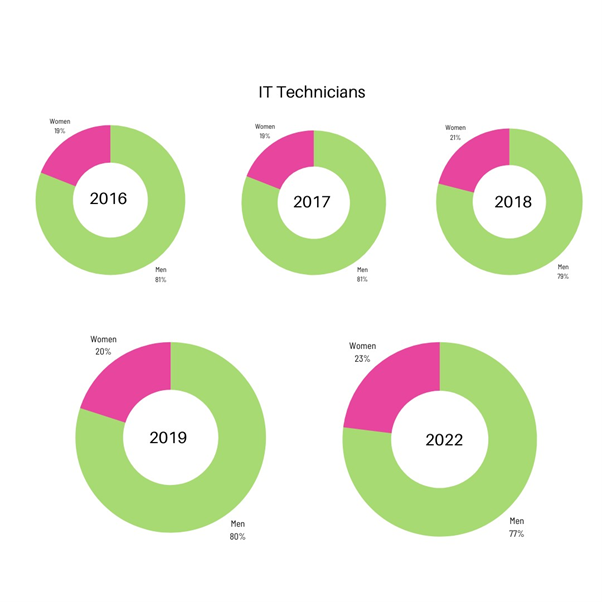
When looking at the number of women working as IT Technicians, the figures have increased from 2016 – 2022. However, because the number of men working as IT Technicians has increased at a rapid rate, the overall percentage of women working as IT Technicians remained fairly static increasing to just 23% by 2022, at a rate of 1% every two years on average. At this rate of change, it will take around 50 years to reach equal representation in this field.
Women in STEM statistics – Conclusion
From our Women in STEM statistics, it is clear that there is still more to be done to reduce the gender gap in STEM fields.
Overall, the percentage of female graduates with core STEM degrees is steadily growing, however, the split is still just 27%. This figure is also translated in the female STEM workforce, with women making up 26%. More work is needed to encourage women to study STEM subjects, to transition into the workforce, and to become future leaders in STEM.
Specifically, computer science and engineering and technology fields show the largest gender imbalances, from current students, to graduates and within the workforce. These sectors are also some of the most financially lucrative, meaning that the high-paying jobs within these fields are predominantly taken up by men, whilst lower paying jobs such as those in healthcare and education are dominated by women.
Physical science-related degrees have seen gradual increases in the number of female graduates enrolled, and in the number graduating, showing that efforts to encourage women to study chemistry and physics-based subjects have seen some positive outcomes.

STEM Women Report
STEM Women recently published a whitepaper report which explores students’ and graduates’ attitudes towards gender issues that are prevalent within STEM. This report uses data collected from the STEM Women community, and uncovers new insights into the current STEM jobs market, gender issues in the workforce, the impact of the pandemic, and career confidence. Titled ‘Understanding the Gender Imbalance in STEM’, we used survey data from 858 STEM students and recent graduates who identify as women or non-binary, studying at universities across the UK. The report reveals a number of key factors affecting the recruitment of underrepresented talent into STEM-related industries, such as the importance of Equality, Diversity and Inclusion.
The responses gathered from the STEM Women community show that students and graduates are now more likely to expect to see equal representation of men and women within an organisation’s workforce, with an increasing number of respondents saying they would be less willing to work for an employer who did not demonstrate a genuine commitment to equality and diversity (69% in 2022, up from 54% in 2019).
Confidence, as a graduate attribute, is another area which has received a lot of attention in recent years, with concerns focussing on the impact of the pandemic on students’ levels of social anxiety and self-doubt. STEM Women’s report shows that this impact continues to be felt – particularly amongst underrepresented groups who are less likely to feel a sense of belonging both in their STEM studies and in the workplace. The concept of ‘Imposter Syndrome’ has also seen increasing media interest and seems to strike a chord with female and non-binary students as well as experienced women in industry, with 61% of those surveyed in 2022 saying they had experienced feelings of imposter syndrome (up from 57% in 2021).
REQUEST THE WHITEPAPER FOR FREE
At STEM Women, we’re on a mission to address this gender imbalance. We target specific University courses and locations to attract the best female and non-binary STEM students and connect them with forward-thinking employers at our networking and graduate careers events. Our events provide employers with the opportunity to introduce their graduate opportunities, speak on a panel, list their job roles online and reach out to the attendees immediately after an event. From sponsorship and stands at careers events, to job boards and recruitment consultants who specialise in sourcing the very best talent, get in touch with us today for more information.