Women in STEM Statistics
*This post has now been updated. View the updated article here.
For years women have been underrepresented in STEM (science, technology, engineering and mathematics) university courses and occupations. Using UCAS data from HESA and findings from WISE campaigns, we wanted to take a closer look at some women in STEM statistics.
We have highlighted the imbalances that occur across STEM subjects at undergraduate level. We have also addressed the gender splits that prevail across the UK workforce within STEM related professions. This article has been updated to include an insight into how the pandemic is affecting female STEM students, a subject that is explored in greater depth in our STEM Women Whitepaper.
At STEM Women we specialise in addressing the gender imbalance in STEM fields by hosting face-to-face and virtual networking events and careers fairs for STEM employers and female students studying a course in these subjects.
Women in STEM Statistics – General Outlook for Female Students
According the recent UCAS data provided by HESA, 35% of STEM students in higher education in the UK are women.
Core STEM subjects – Female students
2017/18
Number of female students – 112,720 – 35%

Subject breakdown – Female students
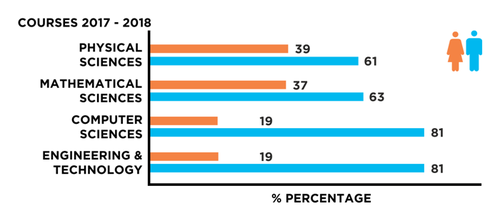
Physical sciences
Female – 22,400 – 39%
Male – 34,800 – 61%
Total – 57,240
Between 2017 and 2018, 39% of students studying physical sciences were female.
Mathematic sciences
Female – 14,100 – 37%
Male – 24,335 – 63%
Total – 38,465
In the same period, the percentage of female students studying mathematical sciences was just 37%.
Computer sciences
Female – 4,525 – 19%
Male – 19,550 – 81%
Total – 24,090
When we looked at the UCAS data for students studying computer sciences related degrees, only 19% were female, with a staggering 81% of students being male.
Engineering and technology
Female – 23,650 – 19%
Male – 102,970 – 81%
Total – 126,660
Similarly, the percentage of female students studying engineering and technology degrees made up a mere 19% of the total students between 2017 and 2018.
Women in STEM Statistics – General Outlook for Female Graduates
Since 2015, the number of women in STEM (women graduating in core STEM subjects) has grown from 22,020 to 24,705 in 2019. On the surface this would appear to show a linear increase, however, due to the more rapid growth in the number of men graduating in these subject areas, the percentage of women in STEM has fluctuated from 25%, down to 24%, and finally up to 26% where it has stalled in 2019.
Core STEM subjects – Female Graduates
2015 – 22,020 – 25%
2016 – 22,340 – 24%
2017 – 22,950 – 25%
2018 – 24,000 – 26%
2019 – 24,705 – 26%

The UCAS data shows that year-on-year, core STEM subjects have seen only a small increase of around 1,000 female students. This shows that efforts to encourage women to enter into science, technology, engineering and mathematics fields has been somewhat successful.
Subject breakdown – Female Graduates

Physical science
2015/16 – 7,505 – 40%
2016/17 – 8,015 – 41%
2017/18 – 8,435 – 42%
2018/19 – 8,325 – 43%
From 2015 to 2018, the number of women graduating in physical science-related degrees has increased by 2%, which equates to approximately 930 more students. This is equivalent to an increase of roughly 500 graduates year-on-year. However, in 2019 the percentage still increased, but the number of women actually dropped by 110. This is due to a drop in the number of males who graduated.
Mathematical science
2015/16 – 3,620 – 39%
2016/17 – 3,765 – 39%
2017/18 – 3,690 – 39%
2018/19 – 3,660 – 38%
In mathematical sciences the number of women grew from 3,620 in 2015/2016 to 3,765 in 2016/17, however, the percentage overall remained static at 39% for both years.
In 2017/18, the number of female mathematical sciences graduates dipped slightly from 3,765 to 3,690, and again to 3,660 in 2019 – the only core STEM subject area to see a percentage decrease.
Engineering and technology
2015/16 – 4,480 – 15%
2016/17 – 4,700 – 15%
2017/18 – 5,050 – 15%
2018/19 – 5,375 – 16%
Disappointingly, the percentage of female engineering and technology graduates has remained constantly low at 15% from 2015 to 2018. However, the exact number of female students has in fact increased by roughly 570 over the period. In 2018/19 it has continued to increase which has led to a 1% increase in the percentage.
Computer science
2015/16 – 2,925 – 16%
2016/17 – 3,020 – 15%
2017/18 – 3,220 – 15%
2018/19 – 3,490 – 16%
Computer science-related degrees also see a relatively low percentage of female graduates. From 2015 to 2018, the percentage has gone from 16% to 15%. In 2018/19, the percentage has again increased back up to 16%.
The overall number of computer science graduates who are female has actually seen an increase year-on-year, but this has only maintained the same percentage overall due to more men opting to study the subject.
General Outlook for Female STEM Workforce
Following our findings from UCAS data provided by HESA, we took a look at some of the Women in STEM statistics from the 2018 and 2019 workforce WISE campaigns. The organisation uses the Office for National Statistics Labour Force Survey data for generating statistics on women in the UK STEM workforce.
Overall, WISE found that the STEM sector is continuing to grow at a rapid rate. From 2017, core STEM employment had increased by 6.3%, which equates to more than 6 times that of the total rise in the UK’s overall employment rate. In 2019, the government data showed that there are now one million women working in core STEM occupations!
Women in STEM workforce
2016 – 802,848 – 21%
2017 – 864,278 – 23%
2018 – 908,318 – 22%
2019 – 1,019,400 – 24%

Since 2016, the number of women working in STEM fields has increased by 216,552, which has taken the total number over the 1 million mark for the first time ever! This means women now make up 24% of the STEM workforce in the UK.
Using the data trends from the last ten years, 2009-2019, WISE have estimated that by 2030, they expect to reach over 29% of women in the STEM workforce.
Subject breakdown – STEM workforce
Engineering professionals
2016 – 36,734 – 8%
2017 – 48,449 – 11%
2018 – 49,250 – 10%
2019 – 50,475 – 10%

In the last decade, the number of women working in engineering roles has almost doubled from 25,000 to just over 50,000. This is positive data; however, the overall percentage split is still very low and has remained static for the past two years even though the numbers have increased.
Science professionals
2016 – 64,563 – 41%
2017 – 57,372 – 42%
2018 – 58,725 – 42%
2019 – 62,675 – 46%

Women in STEM statistics for science professionals continue to show positive results for a growing gender diversity in these roles. Women now make up 46% of the total science professional workforce.
Science and Engineering technicians
2016 – 75,129 – 27%
2017 – 97,064 – 27%
2018 –87,150 – 26%
2019 – 83,525 – 25%

Between 2017 and 2018, roughly the equivalent numbers of men and women left the science and engineering technician workforce. This explains why the percentage of female workers has remained constant at 27%, but fewer women were actually employed in these roles.
In the last year, the numbers of female science and engineering technicians have dropped.
IT Professionals
2016 – 183,149 – 18%
2017 – 172,411 – 17%
2018 – 181,575 – 17%
2019 – 180,600 – 16%

Although the medium-term trend shows female numbers increasing in IT professional roles in 2017, the numbers of men working in these roles are increasing at a faster rate, jumping by 60,000 in the past year. This means the female proportion of the IT professional workforce was still only at 16% in 2019.
IT Technicians
2016 – 43,087 – 19%
2017 – 46,523 – 19%
2018 – 53,600 – 21%
2019 – 53,400 – 21%

When looking at the number of women working as IT Technicians, the figures have increased from 2016 – 2019. However, because the number of men working as IT Technicians has increased at a rapid rate, the overall percentage of women working as IT Technicians remained static between 2016 and 2017, increased slightly in 2018, but has remained static again.
Women in STEM statistics – Conclusion
From our Women in STEM statistics, it is clear that there is still more to be done to reduce the gender gap in STEM fields.
Overall, the percentage of female graduates with core STEM degrees is steadily growing, however, the split is still just 26%. This figure is also translated in the female STEM workforce, with women making up 24%. This shows that some work needs to be done to encourage women to both study these subjects, and transition into the workforce.
Specifically, computer science and engineering and technology fields show the largest gender imbalances, from current students, to graduates and the workforce figures.
Physical science-related degrees have seen a year on year increase in the number of female graduates, showing that efforts to encourage women to study chemistry and physics-based subjects have been successful.
STEM Women Report
STEM Women recently published a whitepaper report that explores students’ and graduates’ attitudes towards gender issues that are prevalent within STEM. This new report uses data collected from autumn 2019, 2020 and 2021 and uncovers new insights into the current STEM jobs market, gender issues in the workforce, the impact of the pandemic, and career confidence. Titled ‘Understanding the Gender Imbalance in STEM’, we used survey data from 557 STEM students and recent graduates who identify as women or non-binary, studying at universities across the UK. The report reveals a number of key factors surrounding how students apply for roles, what they look for in prospective companies, and the specifications they look at before accepting a job offer.
We found that from 2019 to 2021, the percentage of respondents that see diversity initiatives as extremely or very important when accepting job offers rose from 74% in 2019, to 83% in 2020 and 89% in 2021. It also revealed that in 2021, 57% of respondents said they had suffered from or experienced imposter syndrome. Many highlighted that this arose from feeling like the ‘odd one out.’
REQUEST THE WHITEPAPER FOR FREE
At STEM Women, we’re on a mission to address this gender imbalance. We use UCAS data and workforce data to target specific courses and locations to attract the best female STEM students looking to enter into related fields and invite them to our face-to-face and virtual networking and graduate careers events. Our events provide employers with the opportunity to introduce their graduate opportunities, speak on a panel, list their job roles online and reach out to the attendees immediately after an event. From sponsorship and stands at careers events, to job boards and recruitment consultants that specialise in sourcing the very best talent, get in touch with us today for more information.
Enjoy our Women in STEM statistics blog? Check out our piece focused on women in technology and find out how the industry has changed over the years.